Authors
Andrew Symonds Port and Coastal Solutions
Paul Erftemeijer DAMCO Consulting
Numerical models are often used to predict the magnitude and behaviour of dredge plumes to help assess and manage any environmental risks. To provide a realistic prediction of plumes resulting from dredging, numerical models require information on the rate at which sediment is suspended by the dredging, along with the characteristics of the suspended sediment. Previous investigations have shown that in the marine environment, fine-grained sediment suspended by natural processes and dredge-related activities are typically present as aggregated particles known as flocs. This article considers the importance of including the process of flocculation in dredge plume models.

Field measurements have shown that in the marine environment, fine-grained sediment that is naturally in suspension and finegrained sediment suspended by dredging are typically present as aggregated particles known as flocs (Manning, 2004; Smith and Friedrichs, 2011; Beecroft et al., 2019). The process of flocculation in marine environments is most likely to occur due to particle collisions from turbulent motions meaning that increased flocculation occurs when suspended sediment concentrations (SSCs) are higher and moderate turbulence is present (Winterwerp and van Kesteren, 2004). Therefore, the localised elevated SSC and increased turbulence that can occur during dredging has the potential to result in flocculation. However, aspects of dredging that result in very high turbulence such as pumping sediment through pipelines, have the potential to break up existing flocs either down to smaller flocs or individual particles.

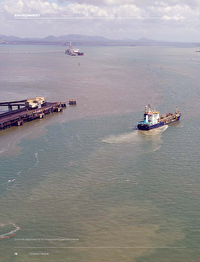
Measured data collected in the Port of Gladstone have shown that flocs were present in a plume generated by a trailing suction hopper dredger (TSHD) dredging silt and clay-sized sediment but that they were smaller than the flocs naturally in suspension (Symonds et al., 2022). This indicates that the turbulence caused by the TSHD did not break up all the flocs present in the dredge sediment, but it did reduce the size of the flocs resulting in the larger flocs >100 microns (μm) being broken up. However, the size of the flocs in the dredge plume were found to increase over time after the plume was generated, demonstrating that ongoing flocculation occurred within the dredge plume. The ongoing flocculation is likely to have been due to flocculation with both sediment suspended by the dredging as well as sediment that is naturally in suspension. These findings indicate that flocculation is an important process that influences how dredge plumes behave, while interactions between dredged and natural suspended sediment could also influence both the behaviour of dredge plumes and of natural suspended sediment.

Port of Gladstone

The Port of Gladstone (the Port) is located within Port Curtis on the east coast of Queensland in Australia (Figure 1). Port Curtis is a macro-tidal embayment with a mean spring tidal range of 3.2 metres. It is a naturally turbid environment and the sediment transport processes are influenced by strong tidal flows, local wind waves and local river discharges. The Port waters cover Port Curtis and the areas offshore extending to the port limits as shown in Figure 1.

Figure 1

Location map showing the Port of Gladstone and its location relative to Australia (inset).

The Port is made up of approximately 50 kilometres (km) of shipping channels, which utilise the natural deeper channels in Port Curtis and offshore wherever possible. Despite this, ongoing natural sedimentation occurs within sections of the shipping channels and annual maintenance dredging is required to maintain depths in these sections. The annual maintenance dredging is undertaken by a TSHD, which dredges sediment from the channels and places it at an approved offshore placement site (East Banks Sea Disposal Site (EBSDS)). The highest sedimentation rates occur at the north-western end of the Port, including Jacobs Channel, with the deposited sediment predominantly made up of finegrained silt and clay (Figure 1). The average natural SSC in the Jacobs Channel region is 14 milligrams per litre (mg/l), with the 99th percentile reaching 64 mg/l.

Approach

A suite of coupled hydrodynamic, spectral wave and sediment transport numerical models were applied to ensure all key processes that influence the transport of natural sediment and sediment suspended by dredging and placement were represented. The modelling was undertaken using MIKE software, which has been developed by the Danish Hydraulics Institute (DHI) and is one of a number of internationally recognised state of the art software packages.

The sediment transport modelling was undertaken using the Mud Transport (MT) module, which is able to describe the erosion, transport and deposition of mud (silt and clay-sized particles) or sand and mud mixtures due to currents and waves. The module can be adopted for sediment transport studies in estuaries and coastal areas, dredging investigations and sedimentation studies, and can represent the process of flocculation.

The spatial discretisation of MIKE’s flexible mesh enabled the model mesh resolution to be varied within the model domain, with higher resolution in areas of interest, such as within the Port waters and channels and lower resolution in offshore areas. This approach assists with optimising the model simulation times without compromising on representing important physical processes within areas of interest. The model extent covered an area of approximately 180 km by 80 km and the resolution of the triangular elements varied from around 2 km in the offshore area to less than 100 metres in the Port channels (Figure 2).

Figure 2

Model mesh and bathymetry around Port Curtis.

Outputs from the hydrodynamic, spectral wave and sediment transport models were compared to in-situ measured data as part of the model calibration and validation process. The calibration and validation demonstrated that the models were able to provide a good representation of the natural hydrodynamic, wave and sediment transport conditions in the region. Example plots comparing the measured and modelled SSC at sites close to Jacobs Channel and the northern entrance to Port Curtis are shown in Figure 3.

Figure 3

Modelled and measured SSC at WB50 and MH10 (see Figure 1 for locations).

The different model setups adopted to represent the natural sediment transport, the dredging related sediment transport and the combined natural and dredging sediment transport were as follows:

  • Natural sediment transport: the model was set up with a spatially varying thickness of natural sediment on the seabed at the start of the simulation (defined as part of the model calibration process), with no sediment in suspension at the start of the simulation and with no suspended sediment input at the boundaries;
  • Dredging sediment transport: the model was set up to represent the sediment transport of the excess sediment suspended by maintenance dredging using a TSHD in Jacobs Channel and the subsequent placement of dredged sediment at EBSDS. The source terms for the mass of suspended sediment released by the dredging activity and placement were determined based on comparison with measured data in combination with information from the literature (Becker et al., 2015). The model did not include any natural sediment on the seabed or in suspension, with the only sediment present in the model being the excess sediment suspended by the dredging. It was assumed that the dredger was dredging in Jacobs Channel and placing within EBSDS nonstop over the model simulation period. In the model, the dredge vessel was assumed to spend the majority of the time sailing to and from EBSDS where the dredged sediment was placed, with the vessel assumed to spend less than 30% of the time dredging at Jacobs Channel. Typically, the 1-2 weeks of dredging in Jacobs Channel required as part of an annual maintenance dredging campaign would be split over the entire dredging campaign (1 month), so continuous dredging in Jacobs Channel is considered unlikely to actually occur and therefore, a worst case scenario for potential plume intensity; and
  • Natural including dredging sediment transport: the model was set up to include both the natural sediment and the sediment suspended by dredging in a single simulation to help understand the relative importance of interactions between the natural and dredged sediment. The model was set up to include both the natural sediment and dredged sediment as detailed in the previous two points. In addition, the model included a second bed layer above the natural sediment layer. This surface bed layer had no sediment in it at the start of the simulation, but any sediment deposited during the simulation (natural or dredged) would be placed in this layer and resuspension of sediment in this layer would occur before the resuspension of the layer of natural sediment below.


Three different particle sizes were used to represent the natural sediment transported in suspension, clay, fine to medium silt and medium to coarse silt. Model simulations were set up with and without flocculation of the fine-grained sediment included. When flocculation was excluded, a constant settling velocity representative of the individual particle sizes was adopted for each and when flocculation was included, the settling velocity varied depending on the SSC, with the minimum settling velocity being representative of the individual particles. For all the simulations that included flocculation, the process of flocculation was assumed to occur when the SSC was above 10 mg/l. For the dredge plume simulations, a single particle size of fine silt was adopted as this was representative of the modal peak in the particle size distribution (PSD) for sediment suspended by the dredging based on measured data. For the dredge plume simulations, the fine silt settling velocity without flocculation included was representative of the individual fine silt particles and the with flocculation simulations were representative of the minimum size of the measured in-situ flocs (30 µm, with the peak in measured flocs in the plume being between 30 and 200 µm). The minimum settling velocity for the dredge plume when modelled with flocculation included was set to represent a small floc rather than the individual particle size. This is because the spatial resolution of the model mesh results in an instantaneous dilution of the plume from the dredger, which will limit flocculation. As the measured data have shown that the majority of the sediment in suspension in the dredge plume close to the dredger is present as flocs, this approach was considered to provide the most accurate conceptualisation of the sediment in the dredge plume.

Figure 4

Modelled 50th percentile natural SSC in the Port region with flocculation (top) and without flocculation (bottom).

Figure 5

Modelled 95th percentile excess SSC resulting from maintenance dredging by a TSHD in the Jacobs Channel and placement at EBSDS with flocculation (top) and without flocculation (bottom).

Results

Influence of flocculation

The modelled natural SSC in Port waters was processed to calculate the SSC percentiles over the 5-week model simulation period. The percentiles are duration-based and show the value by which the SSC was below for a given percentage of time over the entire model simulation period. The 50th percentile modelled natural SSC with and without flocculation included in the model are shown in Figure 4. Comparison between the with and without flocculation plots shows that the most significant differences were within Port waters and in the nearshore areas where higher SSC occurs. With flocculation included, the 50th percentile SSC within Port Curtis was predominantly less than 40 mg/l, while without flocculation included all of Port Curtis had an SSC of more than 40 mg/l. The spatial extent of the SSC, with higher concentrations within Port Curtis and lower concentrations offshore, highlights how Port Curtis is a semi-enclosed bay, which acts as a natural sink of sediment. The measured SSC data shown in Figure 3 shows that the SSC at WB50 (within Port Curtis) remains below 40 mg/l for the majority of the time, indicating that the model results with flocculation included provide a better representation of the actual conditions.

Spatial plots of the SSC due to the maintenance dredging by a TSHD are only shown for the 95th percentile as the 50th percentile shows limited elevated SSC. The 95th percentile SSC resulting from the maintenance dredging at Jacobs Channel and placement at EBSDS by the TSHD is shown with and without flocculation in Figure 5. The results with flocculation included show that the SSC of more than 5 mg/l extends from Jacobs Channel to the southern entrance to Port Curtis. It also shows that a higher concentration plume of more than 15 mg/l occurs within Jacobs Channel, but remains confined within the channel. The results predict a localised low concentration plume at and adjacent to EBSDS, with a peak in SSC of just over 10 mg/l but concentrations of generally less than 5 mg/l.

The results without flocculation included show a significantly larger area with higher concentrations of above 15 mg/l, extending from the north of Jacobs Channel to the southern entrance of Port Curtis. The results also show an SSC of up to 10 mg/l being exported through the north-eastern entrance to Port Curtis. The plume around EBSDS is also larger without flocculation than it was with flocculation, with an SSC of up to 5 mg/l extending from EBSDS to the eastern shoreline of the adjacent Facing Island.

Time series plots of the water level and natural SSC with and without flocculation included at the water quality monitoring site WB50 (see Figure 1 for location) are shown in Figure 6. The results show that the natural SSC is controlled by the tidal range, with higher SSC during spring tides and lower SSC during neap tides. The modelled natural SSC is predicted to be five to ten times higher at WB50 when flocculation is excluded compared to when it is included.

Figure 6

Modelled water level (top), natural SSC at WB50 with and without flocculation (middle) and excess SSC at WB50 resulting from maintenance dredging by a TSHD at Jacobs Channel with and without flocculation (bottom).

Time series results at WB50 for the excess SSC from maintenance dredging using a TSHD in Jacobs Channel with and without flocculation included are shown in Figure 6. WB50 is the closest long-term monitoring site to the dredging at Jacobs Channel. The results show that the predicted SSC in the plume from the maintenance dredging is up to five times higher without flocculation compared to with flocculation.

To help understand the fate of sediment released by the dredging and how flocculation influences it, the spatial distribution of sediment thickness at the end of the model simulations is shown for both with and without flocculation in Figure 7. Both the with and without flocculation results generally show a similar spatial pattern, but sedimentation depths are generally higher when flocculation was included. Without flocculation, the results show the potential for increased sedimentation in the most quiescent locations, such as the sheltered creeks and intertidal areas upstream of Jacobs Channel. With flocculation included the sedimentation depths at EBSDS are predicted to be up to 10 mm, while without flocculation they remain below 0.5 mm. This is more than an order of magnitude difference and suggests that flocculation could be a very important process for the settling of sediment to the seabed and subsequent retention of deposited sediment from the placement activity at EBSDS.

Figure 7

Modelled sedimentation depth after 5 weeks of maintenance dredging at Jacobs Channel by a TSHD with flocculation (top) and without flocculation (bottom).

Influence of natural sediment

Natural SSC is sometimes modelled as well as excess SSC from dredging to allow any potential impacts from the dredging to be related to the natural conditions. However, they are often modelled in separate simulations or with limited interaction between the different sediments for efficiency and to ensure the results from the different sediment sources remain separate. However, in a semi-enclosed bay environment such as Port Curtis where naturally high resuspension occurs due to the astronomical tide and local wind waves, only including the excess sediment released by dredging in the model simulation has the potential to overestimate the ongoing transport and ultimate fate of the sediment. There are two reasons for this:

  • the SSC controls the flocculation that can occur, with floc size increasing as the SSC increases. Therefore, when the natural SSC is included in the model as well as the excess SSC from dredging, it will allow the sediment released by the dredging to mix with the natural sediment as well. This increases the total SSC and allows larger flocs to form that will have a higher settling velocity; and
  • when the sediment suspended by dredging is deposited, it is likely that natural sediment will also be deposited and the two sediments will mix in the surface layer on the seabed with the potential for some particles to be buried under other natural or dredged sediment. When the deposited sediment is subsequently resuspended, some of the resuspended sediment will be the recently deposited natural sediment and some will be the recently deposited dredged sediment. As a result, the total mass of dredged sediment resuspended will be lower compared to when natural sediment was not included in the model. Similarly, the total mass of natural sediment resuspended in areas where dredged sediment was deposited will be slightly lower compared to when the excess dredged sediment was not included in the model.
To assess the relative influence of the natural sediment on the SSC and fate of sediment suspended by maintenance dredging in Port waters, the numerical model was set up to simulate both natural sediment transport and the transport of sediment suspended by dredging together in the same simulation along with flocculation. The modelled 95th percentile excess SSC from the TSHD undertaking maintenance dredging in Jacobs Channel and placement at EBSDS without flocculation, with flocculation and with flocculation and natural sediment transport included are shown in Figure 8.
Figure 8

Modelled 95th percentile excess SSC resulting from maintenance dredging by a TSHD in the Jacobs Channel and placement at EBSDS when flocculation is not included (top), when it is included (middle) and when flocculation and natural sediment transport are included (bottom).

Comparison between the results with flocculation and the results with flocculation and natural sediment transport shows that including natural sediment transport in the model results in a significant reduction in the plume extent and SSC within Port waters, but does not result in such a significant change around EBSDS (where Figure 4 shows the natural SSC is much lower than within Port waters). The extent of the higher concentration area of plume above 15 mg/l in Jacobs Channel is reduced by around 30% when natural sediment transport is also included. In addition, the extent where the SSC is between 1 and 15 mg/l for the 95th percentile is significantly reduced when natural sediment transport is also included in the model.

The reduction in SSC from the maintenance dredging by a TSHD in Jacobs Channel at WB50 due to the inclusion of natural sediment transport in the model is shown in Figure 9. The plot shows that the SSC is reduced by between two and five times depending on the tidal range due to the inclusion of natural sediment transport (up to five times during spring tides and around two times during small neap tides).

Figure 9

Modelled excess SSC at WB50 resulting from maintenance dredging by a TSHD at Jacobs Channel with flocculation (blue) and with flocculation and natural sediment transport (yellow).

Percentile results show that for the 50th percentile and below the natural SSC when flocculation is included and when flocculation and the maintenance dredging at Jacobs Channel are included are almost identical. Plots showing the 80th percentile natural SSC when flocculation is included and when FIGURE 10 Modelled 80th percentile natural SSC in the Port region over a 5-week period with flocculation (left) and with flocculation and TSHD dredging (right). flocculation and the maintenance dredging at Jacobs Channel are included are shown in Figure 10. The plot shows that the natural SSC is similar between the two simulations, except that the extent of the 40 to 50 mg/l contour is reduced within Jacobs Channel and in the adjacent Clinton Channel when maintenance dredging is included.

The SSC is reduced by between two and five times due to the inclusion of natural sediment transport.
Figure 10

Modelled 80th percentile natural SSC in the Port region over a 5-week period with flocculation (left) and with flocculation and TSHD dredging (right).

The relative influence of including the SSC released by the maintenance dredging at Jacobs Channel by a TSHD on the natural SSC at WB50 is shown in Figure 11. The plot shows that there is predicted to be a reduction in the natural SSC at WB50 of up to 2 mg/l when the maintenance dredging is included in the model simulation compared to when the model is simulating just natural sediment transport. For the simulation with both natural and dredged sediment when the excess SSC due to maintenance dredging is added to the natural SSC, the resultant total SSC at WB50 is almost identical to the natural SSC when the model excludes maintenance dredging.

The rate of erosion of sediment from the seabed is controlled by the sediment properties and bed shear stresses from local currents and waves. In Port waters, erosion generally only occurs over a limited period, typically the 2-3 hours when peak flood and ebb currents occur. This means that a limited mass of sediment can be resuspended during each flood and ebb stage of the tide. As a result, the mass of recently deposited natural and dredged sediment that can be resuspended could be reduced for each of the two sediment types compared to when the bed sediment was just a single type. This could occur when the mass of recently deposited natural and dredged sediment on the seabed exceeds the total mass that can be resuspended during a single flood or ebb stage of the tide. This will be more significant in a natural sediment sink such as the Port waters where widespread natural deposition occurs. In addition, as the SSC close to the dredger will be higher when the SSC released by dredging is included compared to just the natural SSC, there will be increased flocculation of both the natural and dredged sediment, which can result in larger flocs forming. These larger flocs will result in a slight increase in sedimentation of both the natural and dredged sediment, and therefore a slight reduction in SSC for both.

Figure 11

Comparison between SSC at WB50 for simulations of just natural SSC and natural plus maintenance dredging SSC.

The potential long-term fate of both naturally suspended fine-grained sediment and sediment suspended by dredging is important to understand. The results from the numerical modelling have been processed to predict the cumulative mass of sediment exported through the two entrances of Port Curtis (southern and north-eastern) over the duration of the simulations. Over the model period, the north-eastern entrance was found to be where the majority of both the natural and dredged sediment was exported. Time series plots showing the cumulative export of sediment through this entrance for natural and dredged sediment are therefore shown in Figure 12. The results predict that the mass of both naturally and dredged suspended sediment exported from Port Curtis would be approximately three times larger if no flocculation occurred. When flocculation was included in the model, approximately 3% of the sediment suspended by dredging was predicted to be exported from Port Curtis, but if flocculation was not included this value increased to 11%.

Figure 12

Cumulative mass of naturally suspended sediment (top) and sediment suspended by a TSHD undertaking maintenance dredging in Jacobs Channel (bottom) exported through the north entrance to Port Curtis with and without flocculation.

Figure 13

Cumulative mass of sediment suspended by a TSHD undertaking maintenance dredging in Jacobs Channel (top) and naturally suspended sediment (bottom) exported through the north entrance to Port Curtis when the model is run with just natural or just dredged sediment and natural sediment plus sediment released by TSHD dredging in Jacobs Channel.

When both flocculation and natural sediment transport were included in the model, the mass of sediment suspended by the TSHD predicted to be exported from Port Curtis was almost an order of magnitude lower than just with flocculation (see Figure 13), with 0.3% of the sediment released within Port Curtis by the maintenance dredging predicted to be exported from Port Curtis. The results therefore indicate that the fate of the majority of the sediment suspended by the maintenance dredging activity (> 99%) is to be deposited within Port Curtis, with very little sediment predicted to be exported from the embayment.

As previously noted, the inclusion of dredged sediment along with natural sediment also had the potential to result in increased flocculation (and therefore deposition) as well as a small reduction in the resuspension of natural sediment. Figure 13 shows that these two processes have resulted in a small reduction in the mass of natural sediment exported from Port Curtis. Including the sediment suspended by the annual maintenance dredging resulted in a small reduction of natural sediment being exported from Port Curtis. The predicted reduction in mass of natural sediment being exported was slightly higher than the mass of sediment released by the maintenance dredging predicted to be exported. Therefore, for the scenario considered to be most representative of actual conditions (flocculation included and dredged and natural sediment modelled together), the modelling predicted that the total combined mass of natural and dredged sediment exported from Port Curtis was similar, but slightly lower than the mass of natural sediment predicted to be exported when just natural sediment transport was modelled on its own.

Conclusions

Numerical modelling has been undertaken to determine how important the process of flocculation is in Port waters for both natural and dredging-related sediment transport. The modelling predicted that the natural SSC would be five to ten times higher if flocculation did not occur, while the SSC of plumes resulting from annual maintenance dredging could also be increased by up to five times if flocculation did not occur. In addition, the modelling results predicted that the process of flocculation reduces the mass of finegrained sediment suspended by maintenance dredging that is exported from Port Curtis by a factor of four.

The mass of both naturally and dredged suspended sediment exported from Port Curtis would be approximately three times larger if no flocculation occurred.

The modelling showed that when natural sediment transport is included in the same simulation as excess SSC from dredging, there is a further reduction in both the predicted SSC due to dredging and the mass of dredged sediment exported from Port Curtis. This is because of an increase in flocculation due to the higher combined SSC resulting from including both natural and dredged sediment, and because the sediment deposited on the seabed is a combination of both natural and dredged sediment. Therefore, when natural sediment transport is included as well as dredged sediment, the eroded sediment will be a combination of natural and dredged sediment, while when natural sediment transport is excluded the sediment will be entirely composed of dredged sediment. As a result, in areas where both natural and dredged sediment are deposited the amount of dredged sediment resuspended will be lower when natural sediment transport is also included.

The modelling results also predicted that due to increased flocculation of natural sediment close to the dredger and some dredged sediment being resuspended rather than natural sediment, there was a small reduction in the natural SSC in some areas when dredged sediment was also included in the model at the same time. This reduction in natural SSC meant that the mass of natural sediment exported from Port Curtis was also reduced. As a result, the total combined mass of natural and dredged sediment exported from Port Curtis was predicted to be similar (slightly lower) to the mass of natural sediment predicted to be exported when just natural sediment transport was modelled on its own. As the natural and dredged suspended sediment have a similar PSD, it is likely that the suspended sediment from dredging will be deposited in locations where similar composition natural sediment has been deposited. It can therefore be inferred that once the sediment suspended by the maintenance dredging is deposited, it is unlikely to result in any additional impacts in terms of SSC or deposition compared to what would naturally occur (assuming that the dredged sediment is not contaminated).

Results from this study highlight how important it is for any numerical modelling related to dredging fine-grained sediment in a marine environment to include flocculation. The study has also shown that in areas with high natural SSC modelling just excess SSC from dredging can result in a significant overestimation of the SSC and ongoing resuspension of the sediment, which could influence potential impacts as well as the ultimate fate of dredged sediment.

Authors

Andrew Symonds

Andrew is a founding director at Port and Coastal Solutions having set up the company in 2017. He completed a PhD at the National Oceanography Centre, Southampton, in the UK, focusing on the hydrodynamics and sediment dynamics associated with managed realignment. With over 20 years of experience in port and coastal projects, he specialises in numerical modelling and marine data analysis, and has extensive experience in sediment transport and dredging projects.

OTHER ARTICLES BY THIS AUTHOR
Paul Erftemeijer

Paul graduated in 1993 with a PhD in Marine Ecology from Radboud University Nijmegen, The Netherlands. He was worked for over 25 years as an applied scientist and in a consulting role with industry and other clients focusing on the prevention of human impacts and restoration of critical marine and coastal ecosystems worldwide, in particular in relation to dredging operations. After working for Wetlands International, DGIS, Deltares and Jacobs, Paul now operates as an independent consultant (DAMCO Consulting) and is affiliated as adjunct research fellow at the University of Western Australia.

OTHER ARTICLES BY THIS AUTHOR
Rachel White

Rachel has worked as a marine consultant in the port sector for more than 15 years after gaining a PhD at the National Oceanography Centre, Southampton, in the UK. Since 2019, she has been a director at Port and Coastal Solutions, a registered company in both the UK and in Australia. Rachel specialises in coastal processes assessments and numerical modelling and is an elected committee member of the Central Dredging Association (CEDA) UK.

OTHER ARTICLES BY THIS AUTHOR
Gordon Dwane

Gordon is the environment project principal for the Gladstone Ports Corporation (GPC). Originally from the UK, he gained a BSc (Hons) in Earth Sciences from Oxford Brookes University and an MSc in Environmental and Ecological Sciences from Lancaster University. Gordon has been an environment management professional for over 20 years and has lived and worked in the Gladstone region since 2004.

OTHER ARTICLES BY THIS AUTHOR

Opening image: © Gladstone Ports Corporation/Queensland Aerial.

PDF download

Download the PDF version of this article with high resolution pictures and layout.

Single-page view

DOWNLOAD PDF Document | 984,45 KB

Two-page view

DOWNLOAD PDF Document | 967,7 KB

Share this page